python数据分析
这篇博文是对anaconda中的jupyter notebook进行的学习
Series in Pandas
documentation ,里面介绍了很多 api
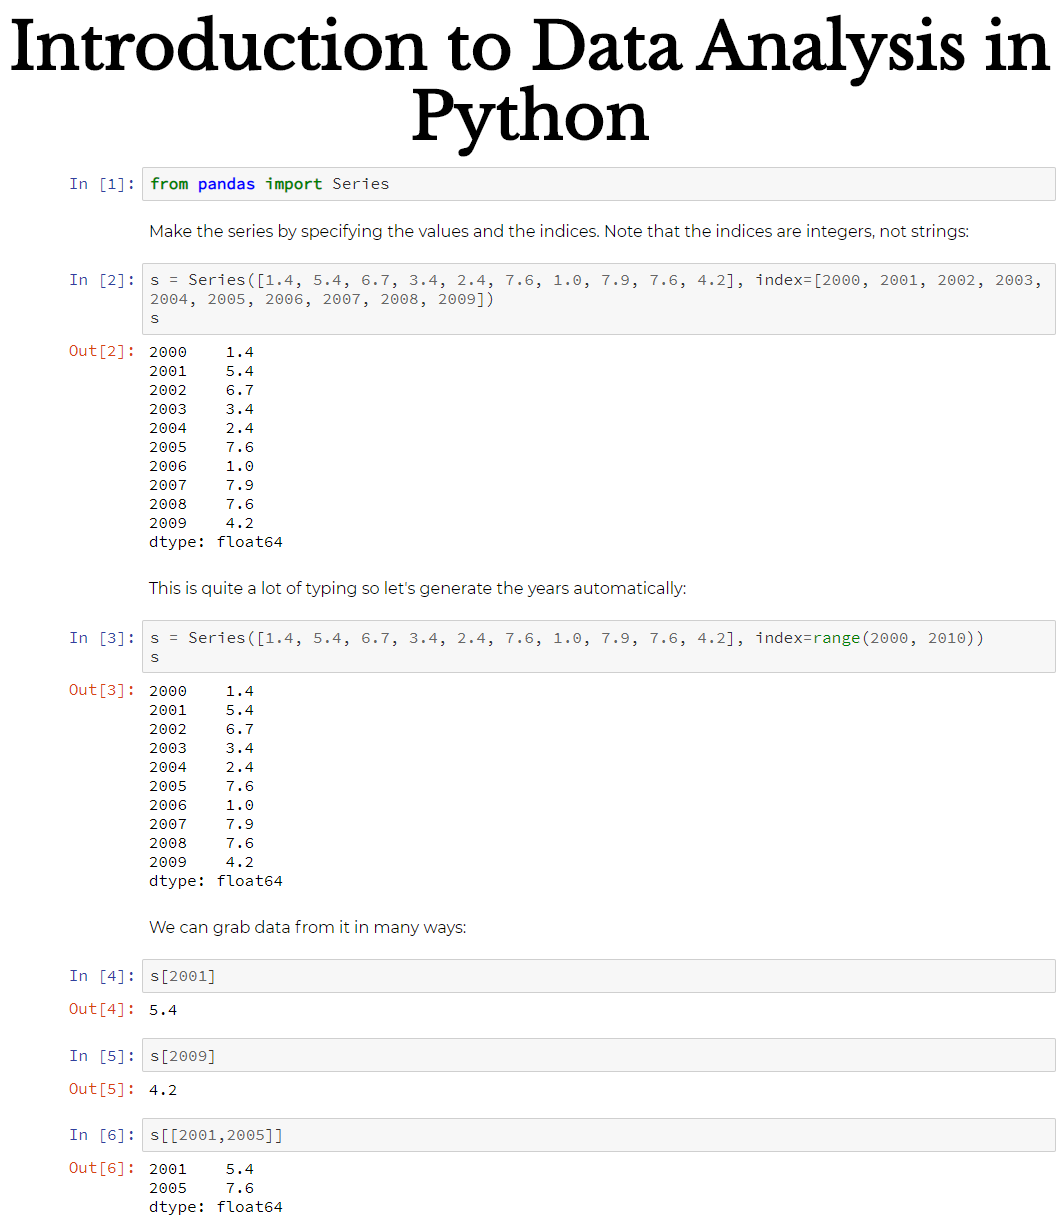
How does a Pandas Series differ from a Python list or dict?
Series against dict:
Similarities:
- Access by any kind of key
Differences:
Seriesis ordered wheredicts are notSeriescan have repeated indices- The data inside is stored with a
dtypewhich makes things faster
Series against list
Simila rities:
- The data inside has an order
- Can index by integer
Differences:
- Even is indexed by integer, the index does not denote position necessarily
- Can index by any kind of key in principle
- The data inside is stored with a
dtypewhich makes things faster
Series operations
Series 和 list 、dict都不一样,单都吸收了他们的优点。
比如我们要把列表中的数字都乘2,那么
当我们直接用list*2 发现只是列表复制了一遍,大小扩充了一倍。如果要实现我们的目标必须运用for语句
1 | [i * 2 for i in my_list] |
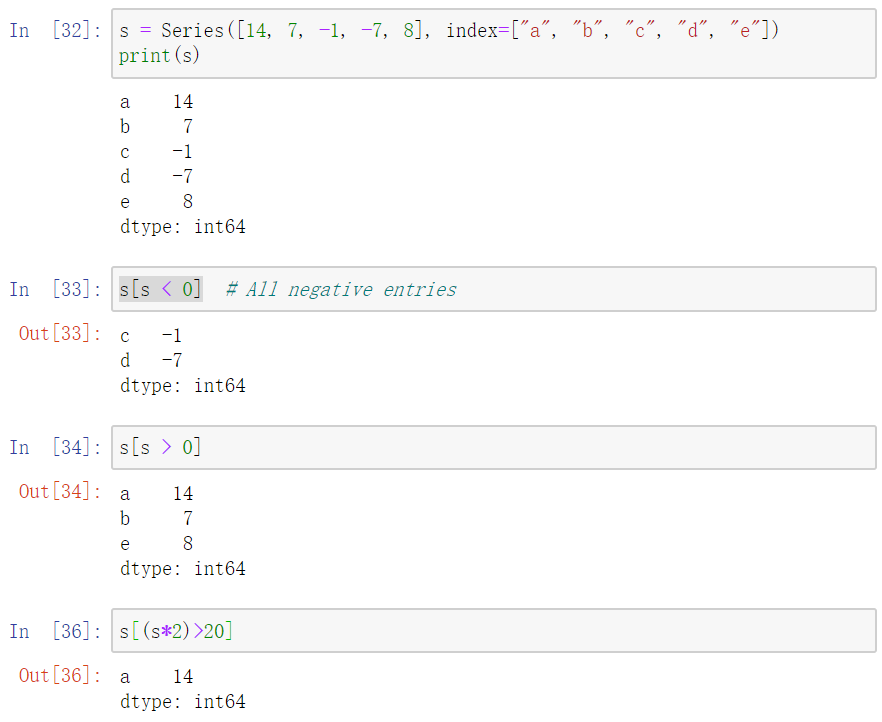
但是对Series,我们直接可以进行上述操作,*2就是所有元素乘2,-2就是把所有元素-2,<8就是把判断所有元素是否小于8
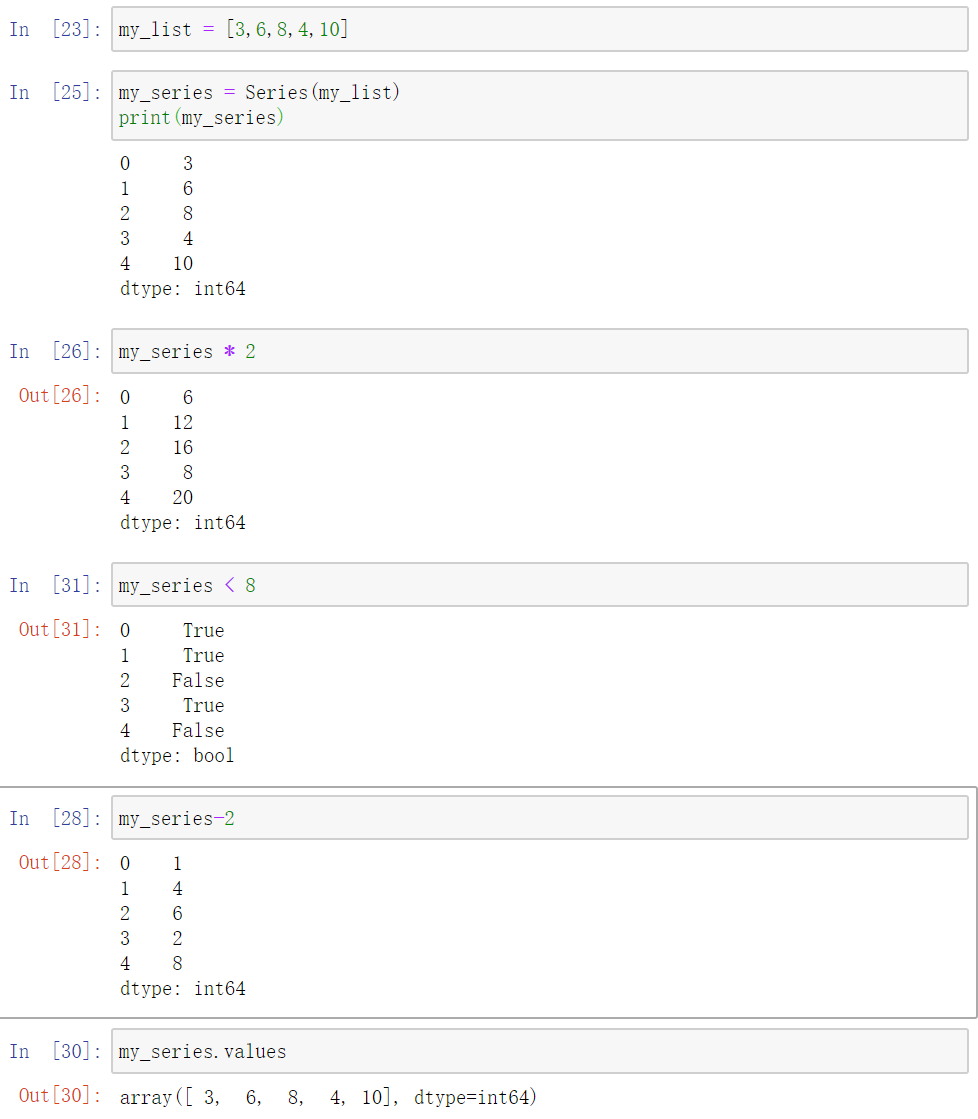
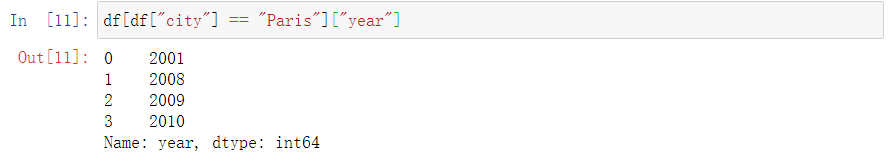
Querying
可以直接在Series中括号中筛选数据,而不是通过判断来人工筛选
Multi-Series operations
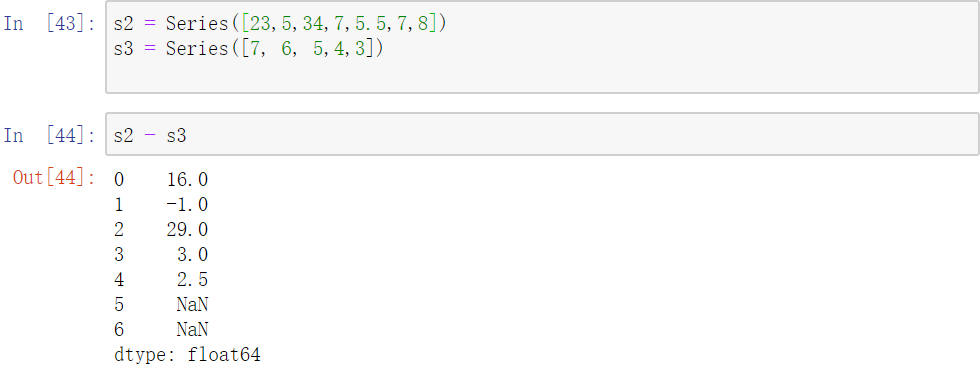
It is also possible to perform operations between two Series objects:
注意到这里的数据类型变成了float,一是因为我有个数据是5.5,二是因为int里面没有NaN这个数,只有float里面有
DataFrame
While you can think of the Series as a one-dimensional list of data, pandas’ DataFrame is a two (or possibly more) dimensional table of data. You can think of each column in the table as being a Series.
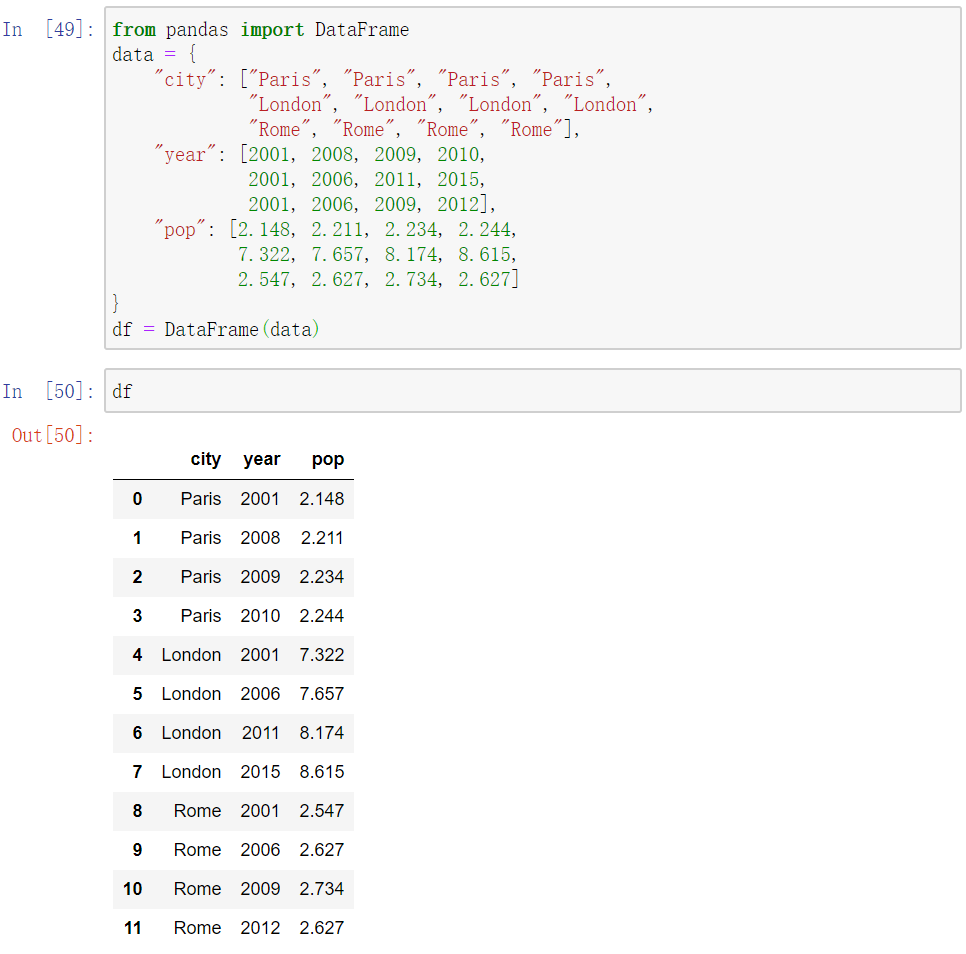
我们有三列数据,因为再data字典中有三个列表
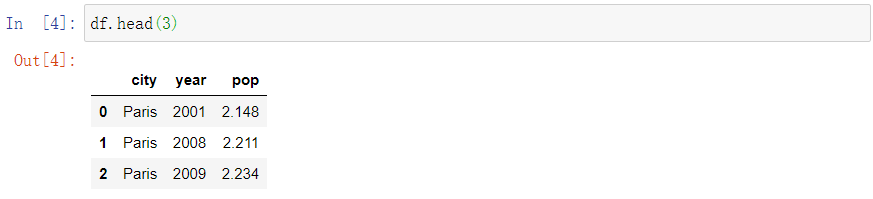
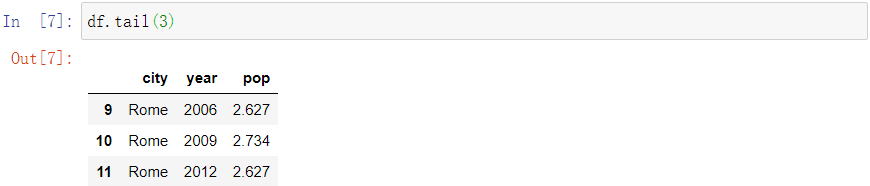
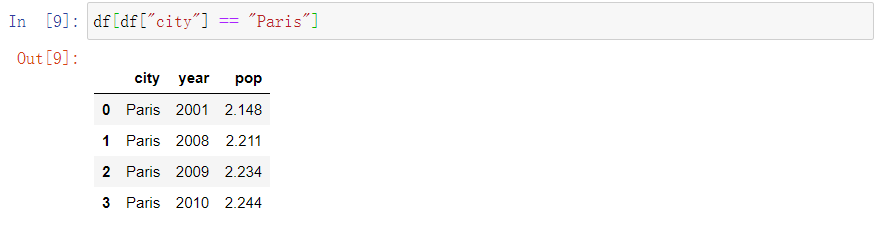
- 我们也可以对dataframe进行筛选,可以从头部也可以从尾部开始筛选
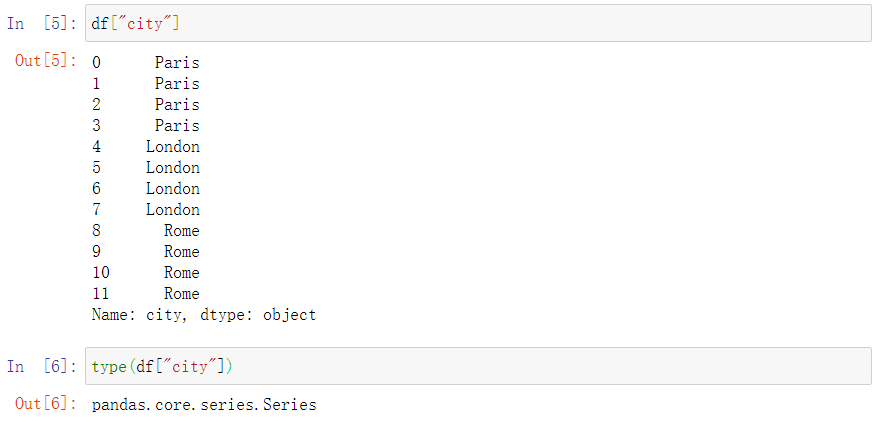
- 也可以筛选一列中的数据
Querying
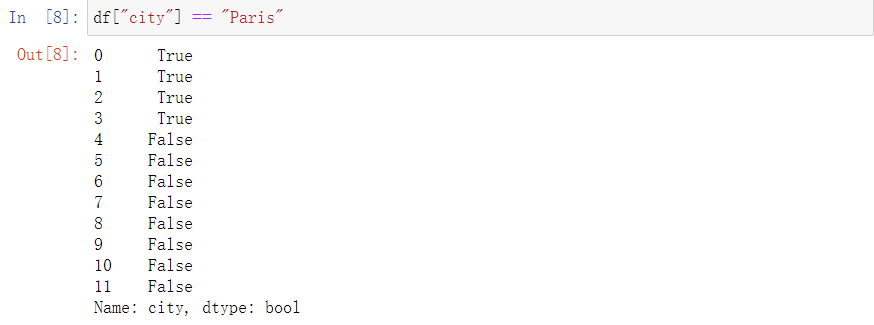
We can start to ask questions of our data in the same way as we did with Series. If we grab a column from the DataFrame and do a comparison operation on it:
也可以判断、筛选 一个Series中的数据
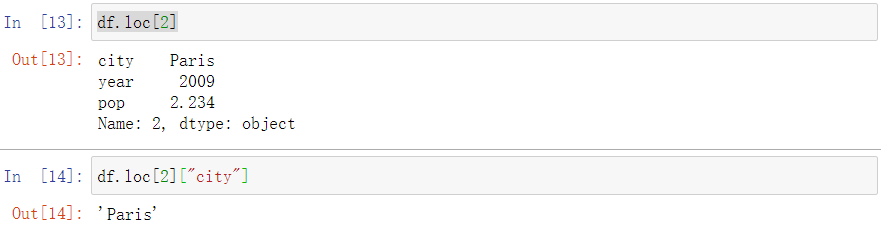
Getting rows
If you want to select a row from a DataFrame then you can use the .loc attribute which allows you to pass index values like:
检索一个行中各类信息、特定信息
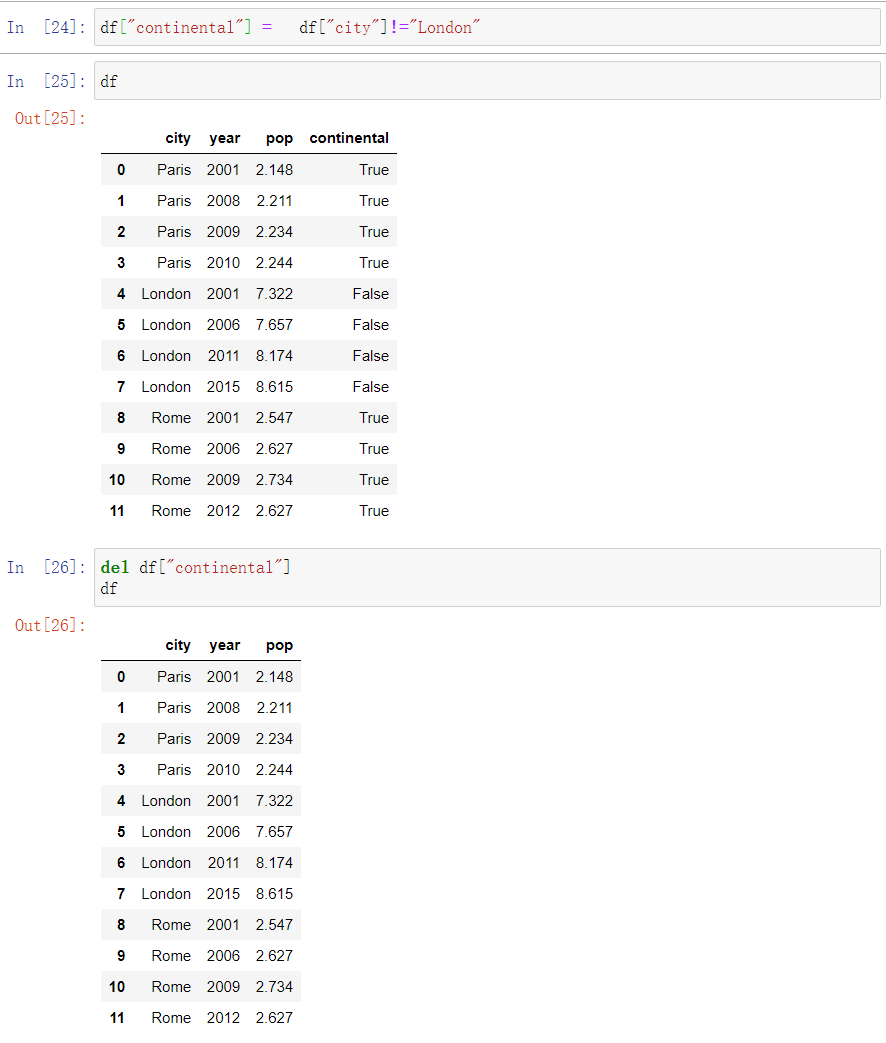
Add and Delete columns
Exercise
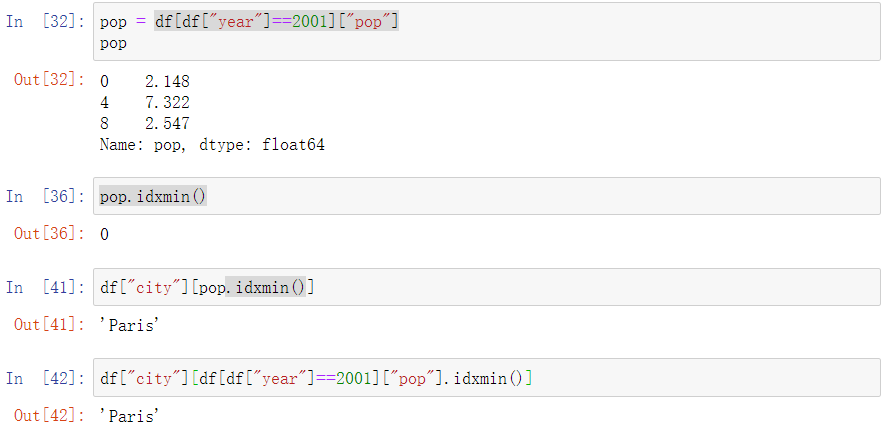
- Select the data for the year 2001. Which city had the smallest population that year?
- 首先选出year=2001年的pop列
- 在pop列中使用idxmin(),获取最小值的idx值,如果使用min(),那么显示2.148
- 在df中city列中查询idx,得到Paris
- 把他们合在一起,就是这样的检索方式
1 | df["city"][df[df["year"]==2001]["pop"].idxmin()] |
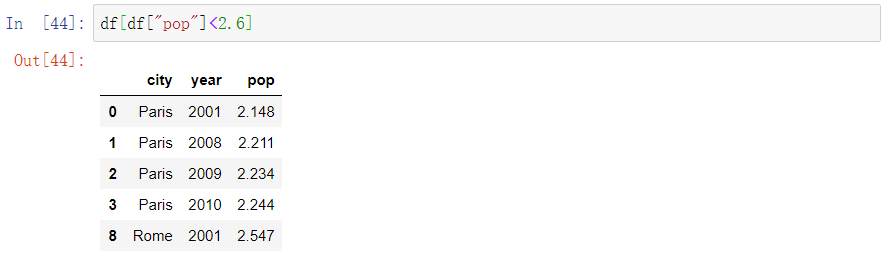
- Find all the cities which had a population smaller than 2.6 million.
Reading from file
One of the msot common situations is that you have some data file containing the data you want to read. Perhaps this is data you’ve produced yourself or maybe it’s from a collegue. In an ideal world the file will be perfectly formatted and will be trivial to import into pandas but since this is so often not the case, it provides a number of features to make your ife easier.
Full information on reading and writing is available in the pandas manual on IO tools but first it’s worth noting the common formats that pandas can work with:
- Comma separated tables (or tab-separated or space-separated etc.)
- Excel spreadsheets
- HDF5 files
- SQL databases
Openfiles
首先我们利用pandas打开文件的操作,对于不同的文件有着不同的打开函数,可以看上面的IO tools查询
先来打开这个csv文件
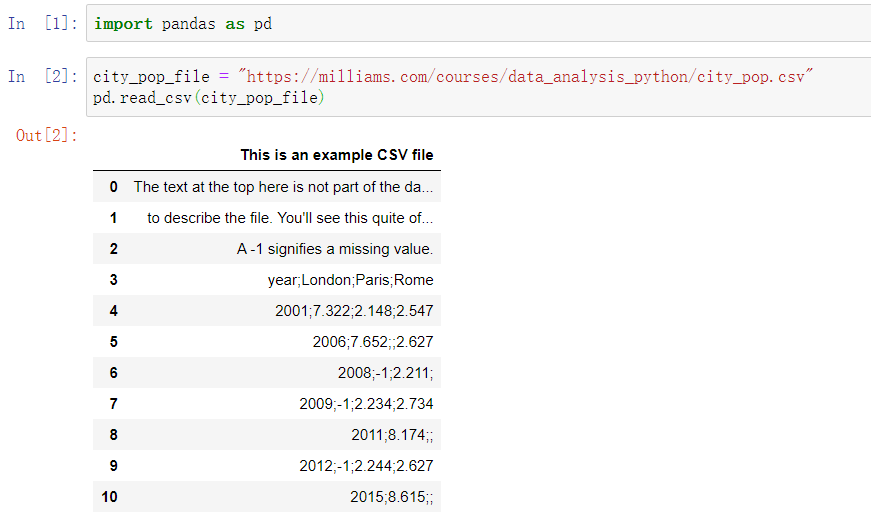
可以看到一开始的数据非常的混乱和糟糕,先让我们用skiprows函数跳过几行,直接到表格内容
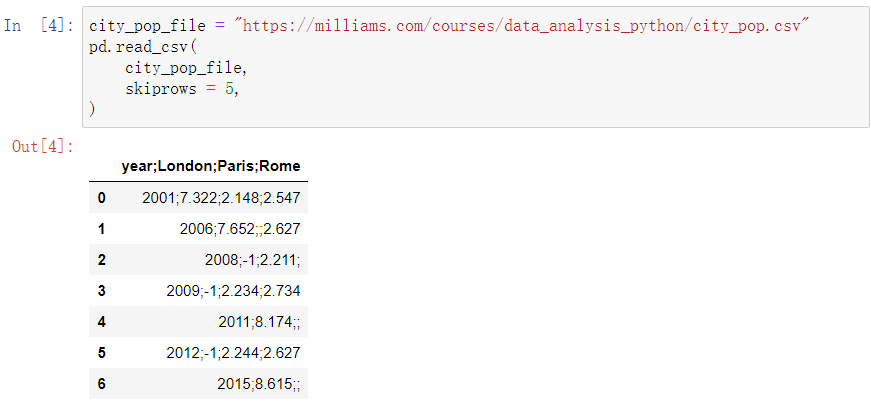
然后我们要找到能够把这个分割成一列一列的函数,这个函数时sep
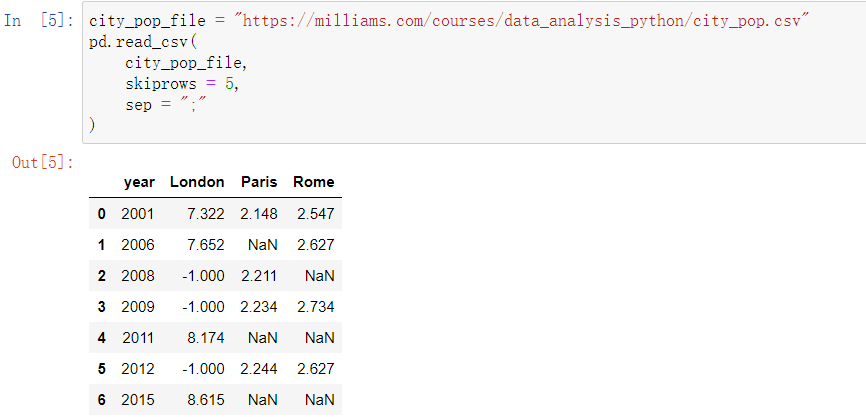
随后我们发现有些数据是-1,这是因为这里的数据没有被读取,我们要用na_values 把它标记为NaN
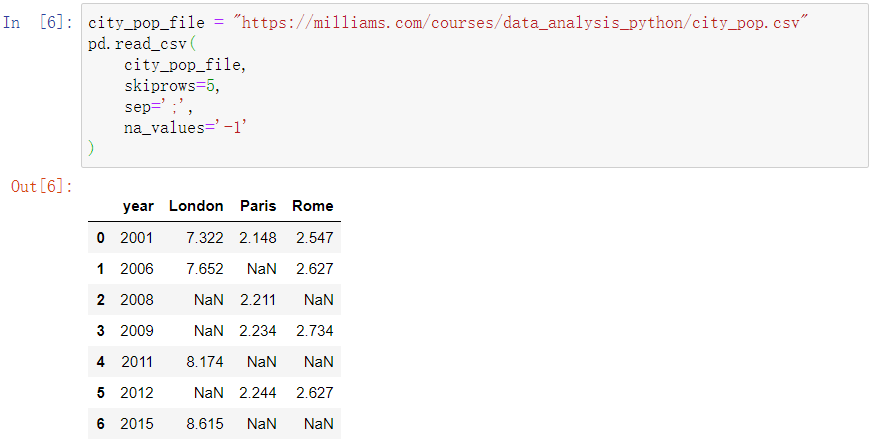
但是这里的索引是0,1….不是很美观,我们想要用year当作索引,可以利用index_col函数
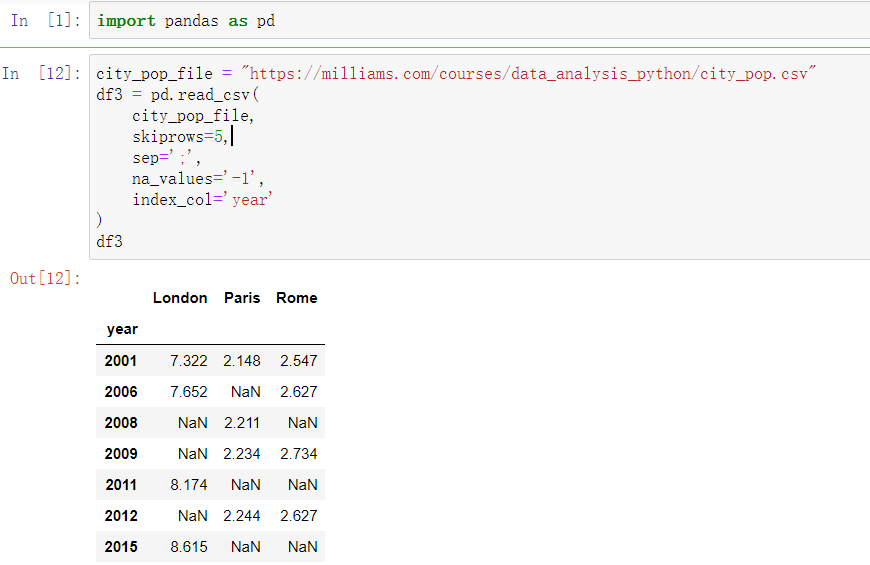
这样就可以对文件中的数据进行处理和筛选了
Exercise
- Open the file at https://milliams.com/courses/data_analysis_python/cetml1659on.dat into Pandas (this data is originally from the Met Office). This contains some historical weather data for a location in the UK. Import that file as a Pandas
DataFrameusingread_csv(), making sure that you cover all the possible NaN values. - How many years had a negative average temperature in January?
- What was the average temperature in June over the years in the data set? Tip: look in the documentation for which method to call.
好,我们看到这张数据表长这样
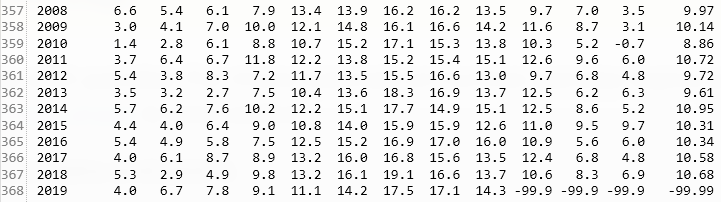
所以按章上面的处理方式,我们并不能通过sep函数来分割列,所以这里用了函数,来分割
1 | delim_whitespace=True, # whitespace separated |
我们看到最后几个月没有数据,所以我们通过na_values函数把他们设置成NaN
1 | na_values=['-99.9', '-99.99'], # NaNs |
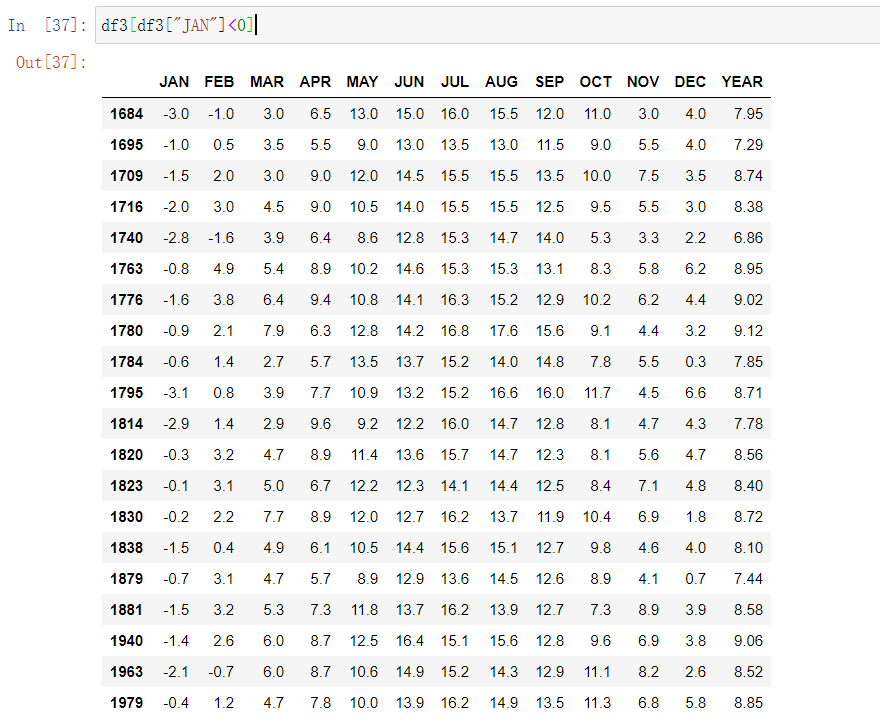
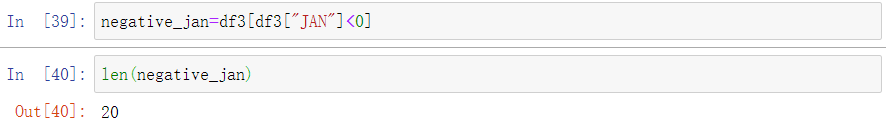
然后要我们处理How many years had a negative average temperature in January?
1 | df3[df3["JAN"]<0] |
这样一句就出来了
利用 len()求出数据条数
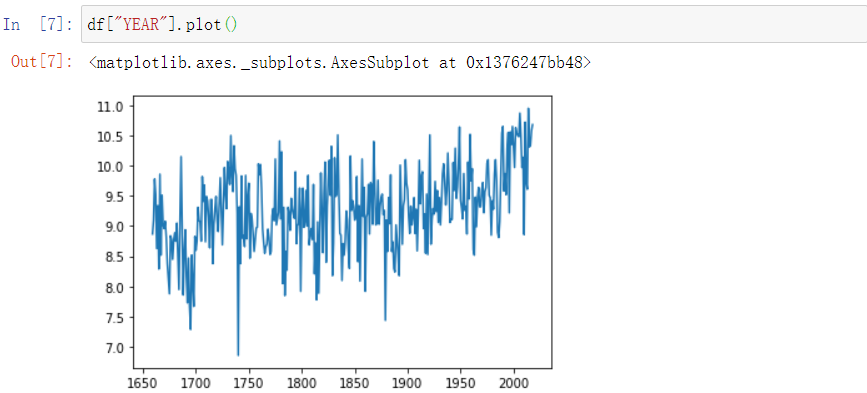
利用mean()函数求出平均数


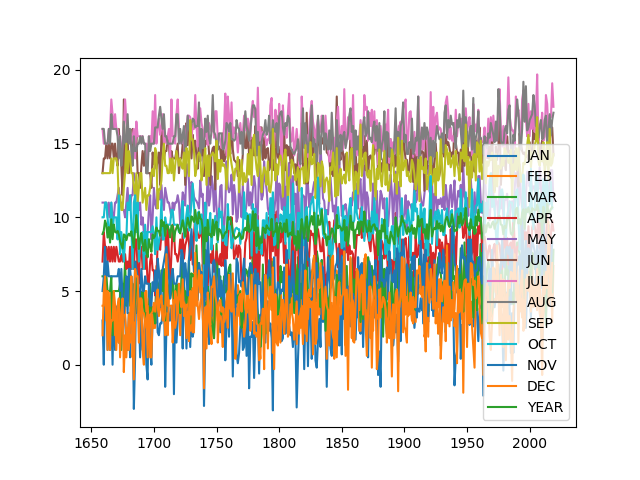
利用matplotlib进行画图
线状图
首先导入matplotlib ,然后导入数据库
1 | import pandas as pd |
如果我们直接写df.plot()那么就会很难看的一张图。。
接下来我们要画出特定的一根线
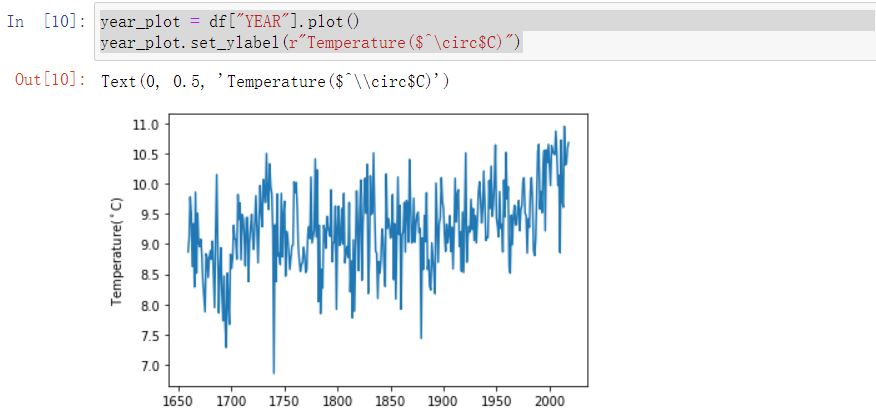
光秃秃的不好看,所以我们要加点标题
1 | year_plot = df["YEAR"].plot() |
$$中的就是数学公式,显示为 $^\circ$C
Exercise
- Make sure you can reproduce the plot above. Try tweaking the labels or which column is plotted.
- Try putting in two
plot()calls with different months (January and July for example) before callingshow(). - Add in a x-axis label
1 | year_plot = df['JAN'].plot() |
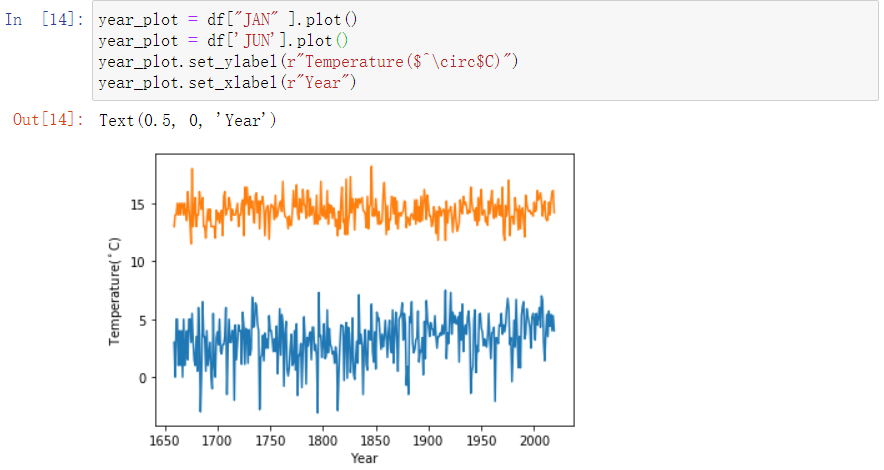
那最后的效果就像这样
字母前加r表示raw string,也叫原始字符串常量。一般用在一下两个方面:

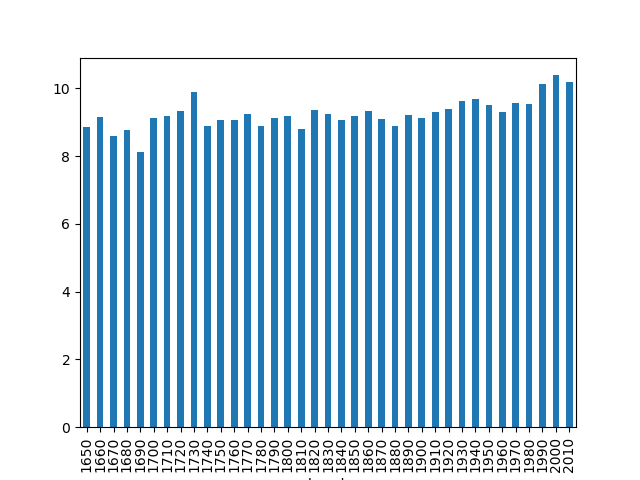
柱状图
如果我们直接用
1 | df["YEAR"].plot.bar() |
那将会是很恐怖的一件事情,因为柱状图会很密很密
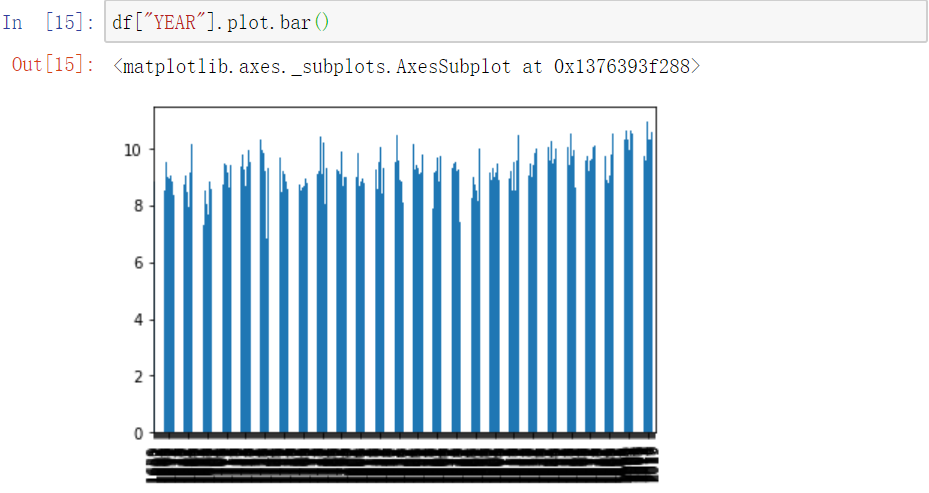
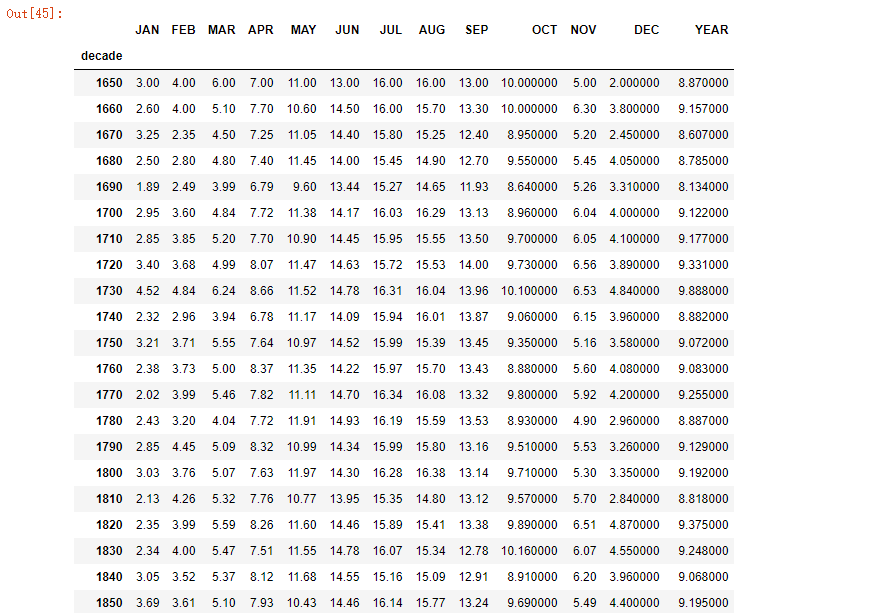
所以我们要对单位做一个分割,用10年做一个分割。这是个重点
1 | from pandas import Series |
直接输出by_decade结果如下: